
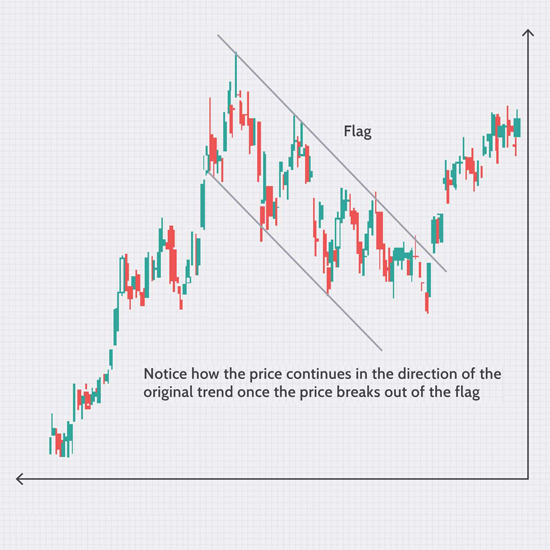
Navigate market movements with precision using our technical analysis and charting insights. We decode price action, chart patterns, and key technical indicators to help you time your trades with confidence.
Whether you're trading Nifty, Bank Nifty, or individual stocks, our analysis includes real-time chart breakdowns, support/resistance levels, and momentum indicators—all designed to capture profitable setups across different timeframes.
Day traders, swing traders, and investors who rely on charts and price action to guide decision-making in volatile markets.